

D.A. Columbus, M.A. Bosompem, and K. Engele
Prairie Swine Centre, Inc., Saskatoon, SK
What’s the problem?
Mycotoxin contamination of feedstuffs used in swine diets continues to be a problem for producers. Research recently conducted at the Prairie Swine Centre has specifically focused on deoxynivalenol (DON), also known as vomitoxin, as it commonly contaminates corn, wheat, barley and other important feed ingredients. According to Biomin (2019), 85% of all grain samples and 90% of finished feed samples contained DON in North America. Data for wheat in Saskatchewan shows an increase in the incidence of Fusarium, with 80-90% of wheat downgraded due to DON contamination. With advances in mycotoxin analysis it has become clear that the mycotoxin problem is much larger than thought and the costs associated with mycotoxin contamination will continue to increase.
Contaminated grains are commonly downgraded for use in livestock feed and, while the best strategy for livestock producers is to avoid feeding mycotoxin-contaminated grain altogether, with the increased incidence and level of contamination this is no longer a viable option. Therefore, many strategies have been proposed to eliminate or reduce the negative effect of mycotoxins in animal feeds. Most of these strategies are based on deactivation of the mycotoxin through binding of the mycotoxin using adsorbents, such as silicate clays and activated carbon, which can be included in feed as non-nutrient additives. In general, however, current feed additives are relatively ineffective in mitigating the negative effects of mycotoxins and may not be effective for all mycotoxins. For example, some adsorbent agents have proven effective at reducing the negative effects of some mycotoxins, such as aflatoxin, but have shown little or no impact in pigs fed DON contaminated diets. Recent studies have examined the use of additives consisting of different blends of yeast/yeast product, preservatives, antioxidants, amino acids, and probiotics which have shown potential for success in DON-contaminated diets in grower-finisher and weaning pigs. There are currently no additives available in Canada for use to mitigate the effects of DON.
As swine are one the most susceptible livestock species to the negative effects of DON, there has been an abundance of research on DON in pigs. In general, however, the majority of studies have been performed in young animals with the assumption that the negative effects of consuming mycotoxin contaminated feed is highest in the young animal. Moreover, previous studies have examined the impact of mycotoxins over a relatively short period of time. Therefore, we sought to answer the following questions:
- What is the long-term effect of feeding DON to grower-finisher pigs?
- Is the effect of DON different in grower vs. finisher pigs?
- What is the economic impact of feeding DON-contaminated diets to grower-finisher pigs?
What did we find?
Two growth performance studies were conducted to examine the impact of long-term feeding of graded levels of DON in finisher (75 – 120 kg) and grower-finisher (35 – 120 kg) pigs. In Study 1, 200 finishing pigs with an initial body weight of 76.6 ± 3.9 kg were group housed in pens with 5 pigs/pen. In Study 2, 240 grower pigs with an initial body weight of 35.9 ± 1.1 kg were group housed in pens with 6 pigs/pen. In both studies, pens were assigned to 1 of 4 dietary treatments (n=10 pens/treatment). Dietary treatments consisted of a control diet (CON) containing no DON or a diet containing 1, 3, or 5 ppm DON (DON1, DON3, or DON5). The basal diet was wheat-barley-soybean meal-based and formulated to meet or exceed nutrient requirements. The dietary DON levels were achieved by replacing DON-free wheat with DON-contaminated wheat and wheat screenings. Individual pig body weight and per pen feed intake were measured weekly for the duration of the studies (42 d for Study 1 and 77 d for Study 2) for determination of average daily gain (ADG), average daily feed intake (ADFI), and feed efficiency (gain:feed; GF).
In finisher pigs we found that there was a rapid negative response to > 1 ppm DON intake, resulting in a decrease in average daily gain and feed intake as well as reduced body weight within the first week (Table 1). The reduction in body weight was maintained throughout the study, however, after a period of approximately 4 weeks, the feed intake and average daily gain of all pigs had recovered. In grower-finisher pigs, the response to DON intake was less pronounced and not as rapid, resulting in variability in the response over time and across treatments (Table 2). Overall there was reduction in average daily gain, feed intake, and body weight in pigs fed > 1 ppm DON, however, this negative effect was less than observed in finisher pigs. There was no impact of dietary DON content on feed efficiency in either study. Overall, these studies provide further evidence for an upper limit of 1 ppm DON in finished feed to avoid reduced performance. While there was an initial reduction in performance, pigs seem to be able to adapt to DON intake of > 1 ppm and < 5 ppm.
Table 1 Growth performance of finisher pigs (75 – 120 kg) fed graded levels of deoxynivalenol
| Dietary Treatment | ||||||
| CON | DON1 | DON3 | DON5 | SEM | P-value | |
| Body weight, kg | ||||||
| Initial | 76.9 | 77.0 | 76.3 | 76.0 | 1.18 | NS |
| Day 7 | 85.4a | 84.8a | 83.0b | 80.8c | 0.34 | <0.001 |
| Day 14 | 95.3a | 95.3a | 92.4b | 88.7c | 0.42 | <0.001 |
| Day 21 | 103.4a | 103.8a | 99.8b | 95.7c | 0.50 | <0.001 |
| Day 28 | 112.1a | 111.9a | 107.8b | 103.0c | 0.53 | <0.001 |
| Day 35 | 119.7a | 119.8a | 114.9b | 110.4c | 0.63 | <0.001 |
| Day 42 | 126.7a | 126.9a | 123.6b | 118.5c | 0.80 | <0.001 |
| Average daily gain, kg/d | ||||||
| Day 0-7 | 1.27a | 1.18a | 0.93b | 0.60c | 0.05 | <0.001 |
| Day 8-14 | 1.40ab | 1.49a | 1.33b | 1.13c | 0.04 | <0.001 |
| Day 15-21 | 1.17ab | 1.21a | 1.06b | 1.01c | 0.04 | 0.004 |
| Day 22-28 | 1.24a | 1.17ab | 1.15ab | 1.04b | 0.04 | 0.033 |
| Day 29-35 | 1.08 | 1.12 | 1.01 | 1.06 | 0.04 | NS |
| Day 35-42 | 1.06 | 1.00 | 1.20 | 1.14 | 0.06 | NS |
| Overall | 1.19a | 1.20a | 1.12b | 1.00c | 0.02 | <0.001 |
| Average daily feed intake, kg/d | ||||||
| Day 0-7 | 2.59a | 2.59a | 2.22b | 1.70c | 0.06 | <0.001 |
| Day 8-14 | 2.98a | 3.07a | 2.89a | 2.55b | 0.07 | <0.001 |
| Day 15-21 | 3.03a | 3.03a | 2.88a | 2.56b | 0.05 | <0.001 |
| Day 22-28 | 3.25a | 3.19a | 3.13a | 2.85b | 0.05 | <0.001 |
| Day 29-35 | 3.22 | 3.20 | 3.19 | 3.04 | 0.06 | NS |
| Day 35-42 | 3.19 | 3.11 | 3.36 | 3.05 | 0.08 | NS |
| Overall | 2.99a | 3.06a | 2.94a | 2.60b | 0.05 | <0.001 |
a,b,cMeans within a row without a common superscript differ
Table 2 Growth performance of grower-finisher pigs (35 – 120 kg) fed diets with graded levels of deoxynivalenol
| CON | DON1 | DON3 | DON5 | SEM | P-value | |
| Body weight, kg | ||||||
| Day 0 | 36.0 | 35.6 | 35.7 | 36.4 | 0.34 | NS |
| Day 7 | 42.5 | 41.6 | 40.7 | 41.7 | 0.44 | NS |
| Day 14 | 50.1a | 49.8a | 47.8b | 49.2ab | 0.49 | 0.01 |
| Day 21 | 58.0a | 57.7a | 55.7ab | 56.7b | 0.60 | 0.04 |
| Day 28 | 68.1 | 67.6 | 65.4 | 65.7 | 0.84 | NS |
| Day 35 | 75.9a | 74.5ab | 72.7b | 72.7b | 0.86 | 0.03 |
| Day 42 | 85.2a | 83.7ab | 81.9b | 81.6b | 0.91 | 0.03 |
| Day 49 | 94.7a | 93.1ab | 90.9bc | 89.8c | 0.96 | 0.005 |
| Day 56 | 102.7a | 100.9ab | 98.3bc | 97.7c | 1.00 | 0.004 |
| Day 63 | 110.6a | 108.6ab | 106.3bc | 105.0c | 0.91 | <0.001 |
| Day 70 | 118.4a | 116.2ab | 114.6bc | 112.9c | 0.91 | 0.001 |
| Day 77 | 124.9a | 123.0ab | 121.0bc | 120.0c | 0.91 | 0.002 |
| Average daily gain, kg/d | ||||||
| Day 0-7 | 0.92a | 0.86a | 0.72b | 0.76b | 0.04 | 0.001 |
| Day 7-14 | 1.09 | 1.17 | 1.02 | 1.08 | 0.04 | NS |
| Day 14-21 | 1.14 | 1.13 | 1.12 | 1.06 | 0.03 | NS |
| Day 21-28 | 1.44 | 1.42 | 1.38 | 1.30 | 0.06 | NS |
| Day 28-35 | 1.15 | 1.12 | 1.14 | 1.11 | 0.04 | NS |
| Day 35-42 | 1.32 | 1.32 | 1.32 | 1.27 | 0.04 | NS |
| Day 42-49 | 1.37a | 1.34a | 1.28a | 1.17b | 0.04 | <0.01 |
| Day 49-56 | 1.13 | 1.11 | 1.05 | 1.13 | 0.06 | NS |
| Day 56-63 | 1.13 | 1.11 | 1.15 | 1.04 | 0.05 | NS |
| Day 63-70 | 1.13 | 1.08 | 1.18 | 1.13 | 0.04 | NS |
| Day 70-77 | 0.93 | 1.03 | 0.91 | 1.00 | 0.06 | NS |
| Day 0-42 | 1.17a | 1.15ab | 1.10bc | 1.08c | 0.02 | <0.01 |
| Day 42-77 | 1.14 | 1.13 | 1.11 | 1.10 | 0.01 | NS |
| Overall | 1.15a | 1.14a | 1.11b | 1.09b | 0.01 | <0.001 |
| Average daily feed intake, kg/d | ||||||
| Day 0-7 | 1.59a | 1.55a | 1.40b | 1.42b | 0.04 | 0.002 |
| Day 7-14 | 1.90 | 1.98 | 1.78 | 1.81 | 0.07 | NS |
| Day 14-21 | 2.03 | 1.95 | 1.93 | 1.95 | 0.06 | NS |
| Day 21-28 | 2.37b | 2.58a | 2.49a | 2.49a | 0.03 | 0.002 |
| Day 28-35 | 2.79 | 2.77 | 2.67 | 2.60 | 0.05 | NS |
| Day 35-42 | 3.17 | 3.07 | 3.09 | 2.95 | 0.08 | NS |
| Day 42-49 | 3.17a | 2.95a | 2.96a | 2.71b | 0.08 | 0.004 |
| Day 49-56 | 3.19a | 3.06ab | 2.99b | 2.94b | 0.06 | 0.01 |
| Day 56-63 | 3.02 | 2.80 | 2.89 | 2.88 | 0.09 | NS |
| Day 63-70 | 3.19 | 3.05 | 3.06 | 2.97 | 0.05 | NS |
| Day 70-77 | 3.05 | 2.99 | 2.94 | 2.91 | 0.07 | NS |
| Day 0-42 | 2.29 | 2.27 | 2.20 | 2.18 | 0.03 | NS |
| Day 42-77 | 3.12a | 2.97b | 2.96b | 2.88b | 0.05 | <0.001 |
| Overall | 2.62a | 2.55ab | 2.47b | 2.47b | 0.03 | 0.003 |
a,b,cMeans within a row without a common superscript differ
What will this cost you?
The Prairie Swine Centre Enterprise Model was used to assess the economic impact of feeding DON-contaminated grain to pigs. It is important to note that the following assessment was based on the results of the current studies as well as a number of other assumptions (e.g., grid, market weight, current market prices). Therefore, these results are meant only as an indicator of the potential economic impact and the specific economics will be dependent on individual production parameters. Producers need to weigh several factors when considering feeding DON contaminated grains in their operations, the most important being – What are the costs associated with it? Results from this project have shown, that pigs consuming high levels of DON, in complete diets, will be 5-8 kg lighter by the time they reach market weight. However, these pigs also consumed less total feed. Does this drop in feed consumption, and total feed cost, outweigh the drop in market revenue from the sale of hogs at a lighter weight? The simple answer is no, however it depends when pigs are introduced to DON in their diets.
Figure 1 shows the margin over feed cost when pigs (at average market conditions) are fed varying levels of DON in complete diets and when DON is introduced at different stages in the production cycle. Results indicate little to no change in returns when pigs are fed diets containing 1 ppm of DON – regardless of when it was introduced. In both studies, no significance was found in final market weight between control and diets containing 1 ppm of DON. Results also indicate an inverse relationship between margin over feed cost and the level of DON in the diet for both studies, in other words increasing DON reduces producer returns. However, the negative impact on margin over feed cost is far greater when pigs are first introduced to DON in the finishing period. This indicates the negative impacts of DON are less when introduced earlier to pigs in the production cycle. Based on the results of this study we would estimate between a $2 -$7 per hog drop in revenue under average market conditions. Therefore, it would be in the producer’s best interest to avoid contaminated grains when possible.
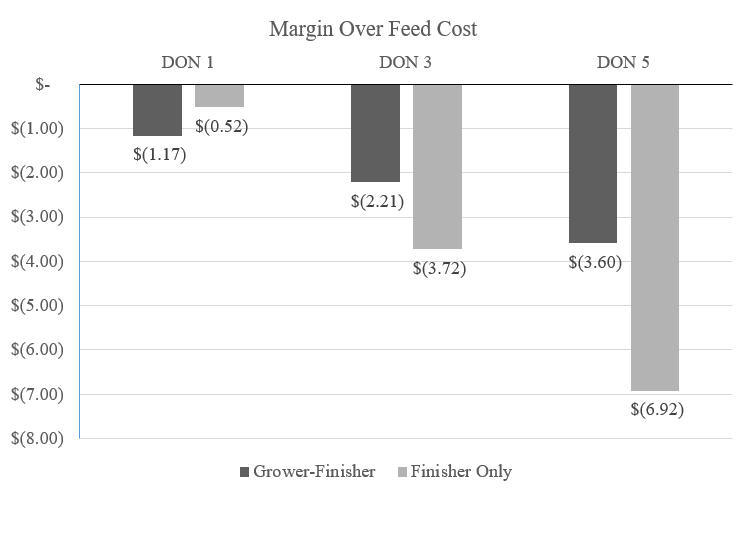
Figure 1 Margin over feed cost for diets containing various levels of DON
In order to balance the drop in returns (margin over feed cost), producers will need to buy DON contaminated grains at a discount, compared to clean grain, in order or make feeding DON contaminated grain a viable option. Figure 2 shows the estimated drop in finished feed cost (per mt) for various levels of DON contaminated diets required to have no impact to margin over feed cost (returns) to the producer. The finished diet will need to drop in price between $11 – $63 per tonne, depending on level of contamination and exposure to DON, in order to have no change in margin over feed cost.
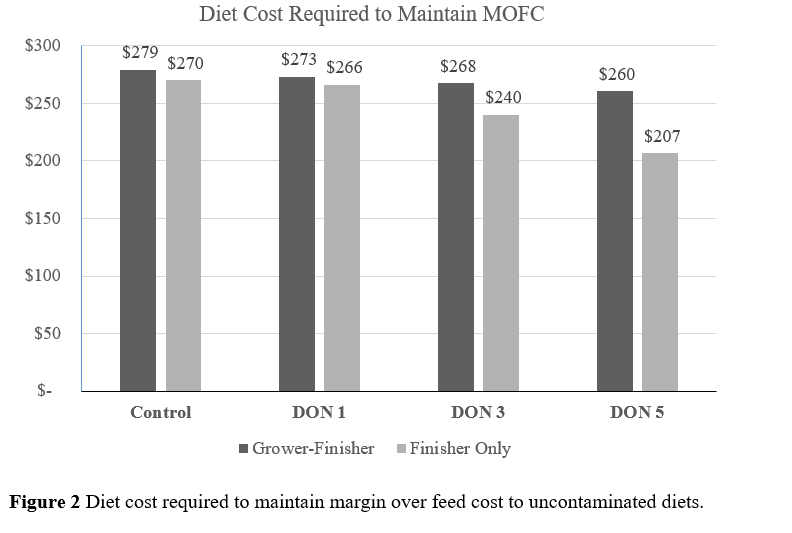
Figure 2 Diet cost required to maintain margin over feed cost to uncontaminated diets.
Figure 3 displays the drop in (DON contaminated) ingredient price required when that ingredient would make up 40% of the total finished diet. If we assume clean grain can be purchased at $225/mt – producers will need to purchase the DON contaminated ingredient at a significant discount, up to $155 mt, in order to justify feeding 3 or 5 ppm of DON in a diet. It is important to remember an ingredient containing 2.5 ppm making up 40% of the diet translates to 1 ppm in the final diet, and it would take 12.5 ppm of DON in an ingredient to achieve 5 ppm in a diet.
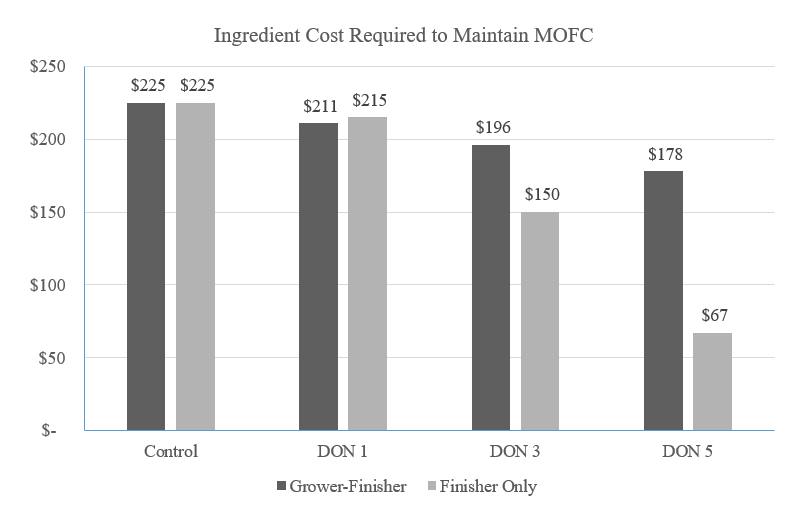
Figure 3 Ingredient price of contaminated grain, at 40% of the diet, required to maintain margin over feed cost at uncontaminated levels.
There are additional considerations that producers must take in account when feeding DON-contaminated. In theory, if we could simply purchase DON contaminated grains cheaper we could maintain margin over feed cost, however, it is not that simple in practice and may not be possible. If these savings cannot be achieved, pigs fed DON-contaminated diets will need to be kept in the barn longer due to slower growth, increasing costs and reducing throughput. Adding 5 days to market adds approximately 4.5% to fixed costs, as fewer pigs can be marketed from the barn in a year. In farrow-to-finish operations, many facilities simply cannot afford to keep pigs 5 days longer. Logistics are another important consideration. If farms do not have the ability to separate the DON contaminated ingredients from clean grain, the entire herd would receive the DON ingredient – perhaps creating additional challenges in other parts of the production system. It is also important to note that this economic analysis examines the impact of feeding DON on based on one specific grading grid. As packers have different requirements, the change in margin over feed cost would be packer specific and shipping at lighter weights (associated with higher levels of DON) may be more detrimental in some cases. Finally, the use of DON-mitigating feed additives, while potentially effective, also result in increased feed costs, therefore, producers would need to weight the potential benefits against the costs of these products.
Take home message
- In finisher pigs, feeding of diets with > 1 ppm DON results in an initial reduction in feed intake and average daily gain. This results in a reduction in body weight which is sustained over time. Growth performance recovers after a period of time, indicating that pigs may be able to adapt to DON intake. The response to DON appears to be reduced and more variable in grower pigs than in finisher pigs.
- The negative effects of DON intake appear to be due largely to reduced feed intake. This is supported by lack of negative effects of DON intake on nutrient utilization, health status, and carcass quality.
- Feeding diets containing > 1 ppm DON will result in reduced margin over feed cost. This reduction is greater when DON is first introduced in the finisher period compared to the grower period.
- Producers may be able to feed DON-contaminated diets, up to 5 ppm, while making adjustments (e.g., reduced ingredient/feed cost, increased days to market, mycotoxin mitigating feed additives) for the negative impact of DON intake on growth performance.
Acknowledgements
These studies were supported by the Saskatchewan Ministry of Agriculture and the Canada-Saskatchewan Growing Forward 2 bi-lateral agreement, the Barley Development Commission of Saskatchewan, and Mitacs. General program funding for the Prairie Swine Centre is provided by the Government of Saskatchewan, Saskatchewan Pork Development Board, Alberta Pork, Manitoba Pork, and Ontario Pork.


