

Sow death loss continues to challenge pig farmers. Hence, further characterization of the problem may be helpful toward finding solutions.
Our group characterized sow mortality at a 2600 head commercial sow farm in eastern North Carolina over a 27-week period. Sows were housed in individual stalls during gestation. Therefore, there was limited competition between sows during feeding. Sow mortality was specifically evaluated between day 95 of gestation and 30 days post-farrowing. Females were evaluated at day 95 of gestation for body condition using the Knauer sow body condition caliper (<12 = “BCS 2”, 12 to 15 = “BCS 3”, 16 to 18 = “BCS 4”, >18 = “BCS 5”). Farm recorded sow mortality codes included difficult farrow (7%), lameness (32%), prolapse (21%) and unknown (40%). Of the 3,340 sows evaluated, 190 (5.7%) died between day 95 of gestation and 30 days post-farrow.
Sow mortality was statistically associated (P<0.05) with parity (Figure 1). First litter females were more likely to survive relative to older parity sows.
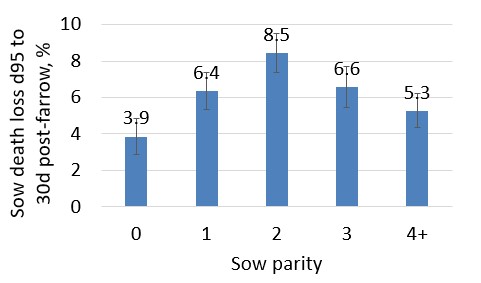
Figure 1. Relationship between sow parity and sow death loss from day 95 of gestation to 30 days post-farrow.
Figure 2 shows the relationship between sow mortality and sow body condition. Heavier conditioned sows were more likely (P<0.05) to survive. Associations between farm recorded mortality codes with the sow body condition caliper are shown in Figure 3.
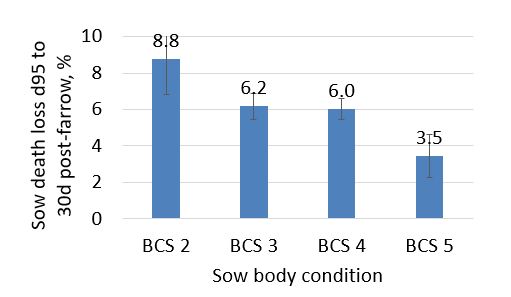
Figure 2. Association between sow body condition score (BCS) and sow death loss from day 95 of gestation to 30 days post-farrow.
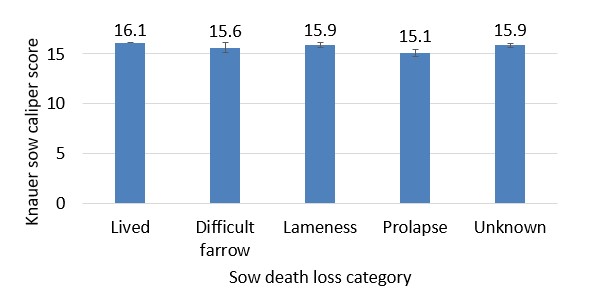
Figure 3. Association between sow body condition (Knauer sow caliper score) and sow death loss category. A one-unit change in sow caliper score equates to approximately 1/3 of a body condition score when using a 1 to 5 BCS scale.
Sows that prolapsed were statistically thinner (P<0.05) than sows that lived, sows that were euthanized for lameness, or those that died for unknown reasons (caliper scores 15.1 vs. 16.1, 15.9 and 15.9, respectively). A one-unit change in sow caliper score equates to approximately 1/3 of a body condition score when using a 1 to 5 BCS scale. Hence, on a 1 to 5 BCS scale, sows that prolapsed were approximately 1/3 of a body condition score thinner than sows that lived.
Does this data support increasing herd body condition from “ideal” to “fat” to enhance sow survival? Perhaps not. Our statistical model showed parity and sow body condition together explained a very small amount of the variation (less than 2%) in sow death loss. Hence, it may be wise to focus on factors that have a greater relationship with sow death loss. Questions can be sent to Mark Knauer at mtknauer@gmail.com.


